Are you winning when it comes to providing a great customer experience? Even if you are, do you really know? Is there any hard evidence?
If you don’t, that means you haven’t been tracking any customer experience KPIs.
Measuring customer experience is essential for delivering a great customer experience and growing your business. So in this guide, I’ll talk about the key customer experience metrics to keep an eye on.
Disclaimer: If you buy any products through links on this site, I may earn a commission. But it doesn't make any difference to your cost, and it helps me keep this blog running. So you could always read my articles for free.
What are customer experience metrics?
Customer experience metrics are the numbers and values that provide you with tangible insight into your brand’s performance in terms of delivering a great experience to customers.
Now, you can just rely on customer testimonials to see how the business is doing. But it’s really the hard data and statistics that show you the full picture.
Measuring customer experience helps you understand whether your customer experience strategy is hitting the mark.
How to measure customer experience?
Let’s start with the good news. Most customer experience platforms these days come preconfigured with commonly used metrics and KPIs.
This is certainly useful, but you still need to figure out which metrics are the most important for your business, and how to read them.
How do you determine these customer experience KPIs? Reflect back on your unique value proposition. What does your business do best?
Is your selling proposition obvious in every part of your customer experience journey? That’s what you want to measure. So, pick the metrics that match your goals.
What are the essential customer experience metrics?
Below, you’ll discover essential customer experience metrics that help businesses measure satisfaction, loyalty, and engagement, driving improved customer service and overall success.
Customer retention rate
Time and again, many studies have shown that retaining existing customers is more profitable than going after new customers.
Needless to say, you want to keep a close eye on whether your current customers are continuing to be your customers.
Do they keep buying from you or leave after a certain period? The customer experience metric that gives you this information is the customer retention rate.

The higher your customer retention rate, the better your company’s ability to keep current customers satisfied and have them buy from you on a regular basis.
Ticket volume
Ticket volume refers to the number of customer service requests or inquiries you receive over a given period.
It’s typically measured by tracking the total count of support tickets submitted through various channels like email, phone, chat, or social media.
For example, if your company receives 500 support requests in a week, that’s your ticket volume for that period.
Why is understanding your ticket volume crucial? Because it helps you manage your customer service team’s workload.
High ticket volume may indicate an increase in product issues or a spike in customer demand. When ticket volume is high and not managed effectively, response times can increase, leading to customer frustration.
When this happens, you can allocate more resources to maintain service quality.
Conversely, low ticket volume might suggest that your customers are satisfied or that your self-service options are working well.
To put it simply, keeping this customer experience metric in check helps you provide timely and efficient support, improving overall customer satisfaction.
Average resolution time
Average resolution time in customer experience analytics is the amount of time it takes for your customer service team to resolve a customer issue from the moment a ticket is opened until it’s closed.

How do you measure this? Just take the total time spent on resolving all tickets over a given period and divide it by the number of tickets resolved.
For example, if you resolved 100 tickets in a week and spent a total of 500 hours on them, your average resolution time is 5 hours per ticket.
Customers appreciate quick and effective solutions, so keeping your average resolution time low is key to maintaining positive relationships.
A shorter resolution time usually indicates efficient service, leading to higher customer satisfaction.
On the other hand, a high average resolution time may signal inefficiencies in your process or understaffing, which can frustrate customers and harm your brand’s reputation.
Monitoring and optimizing this customer experience metric helps ensure you’re meeting customer expectations.
First contact resolution rate
First contact resolution rate (FCR) is the percentage of customer inquiries or issues that your support team resolves during the first interaction, without the need for follow-up.
It’s measured by dividing the number of tickets resolved on the first contact by the total number of tickets, then multiplying by 100. For example, if you resolved 80 out of 100 tickets on the first contact, your FCR rate is 80%.
FCR plays a crucial role in customer experience because customers value efficiency. A high FCR rate indicates that your team is knowledgeable and capable, reducing the need for customers to make repeated contact, which can be frustrating.
Conversely, a low FCR rate may indicate gaps in training or resources, leading to longer resolution times and potentially dissatisfied customers. Improving FCR helps you boost customer satisfaction and loyalty.
Net promoter score
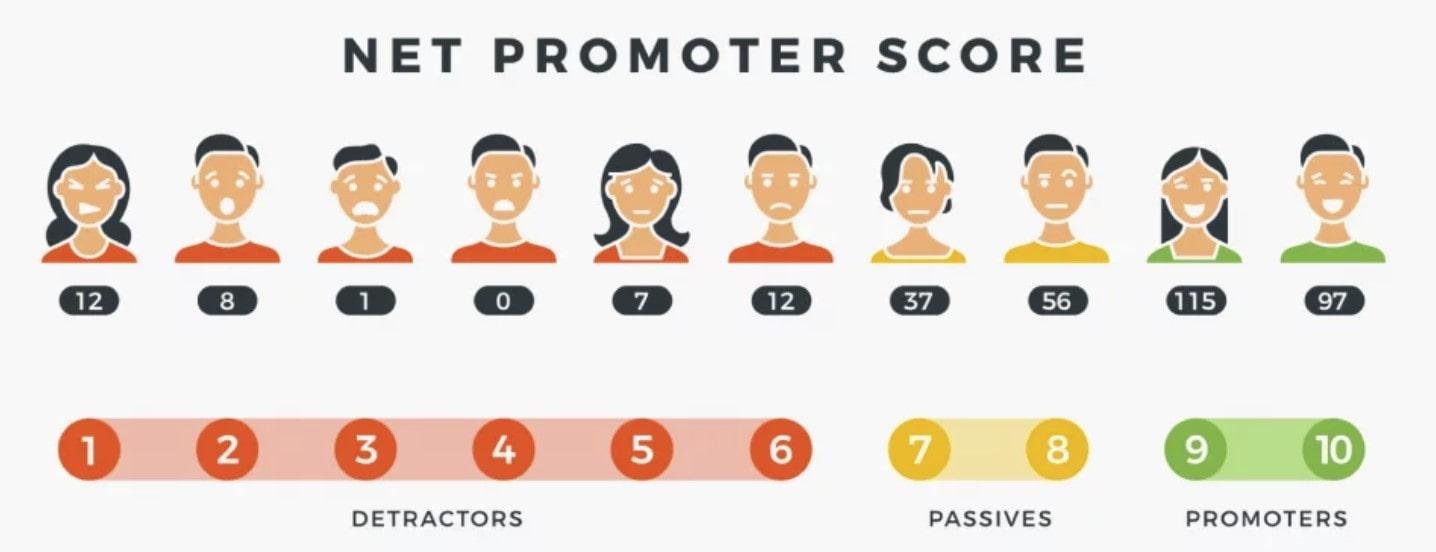
Net Promoter Score (NPS) is a key customer experience metric that measures customer loyalty by assessing how likely your customers are to recommend your product or service to others.

It’s measured by asking customers, typically on a scale from 0 to 10, “How likely are you to recommend us to a friend or colleague?”
Depending on the answers, customers are classified into three categories: Promoters (9-10), Passives (7-8), and Detractors (0-6). To calculate your NPS, subtract the percentage of Detractors from the percentage of Promoters.
NPS provides insight into overall customer satisfaction and brand loyalty. If it’s high, that means customers are happy and likely to promote your brand, leading to potential new business through word-of-mouth.
For example, if 70% of respondents are Promoters and 20% are Detractors, your NPS would be 50. Monitoring and improving NPS helps you identify areas for enhancing customer experience and fostering long-term loyalty.
Churn rate
Churn rate is the percentage of customers who stop using your product or service over a specific period.
It’s measured by dividing the number of customers lost during that period by the total number of customers at the beginning of the period, then multiplying by 100.
For example, if you had 10,000 customers at the start of the month and lost 500, your monthly churn rate would be 5%.
A high churn rate often signals issues like poor service, unmet expectations, or better offers from competitors, suggesting that customers aren’t finding long-term value in your product.
Conversely, a low churn rate indicates that customers are staying with you, reflecting positively on your customer experience efforts.
By closely monitoring churn rate, you can identify areas where your service may be falling short and implement strategies to retain more customers, ultimately boosting your business’s growth and profitability.
Customer satisfaction score (CSAT)
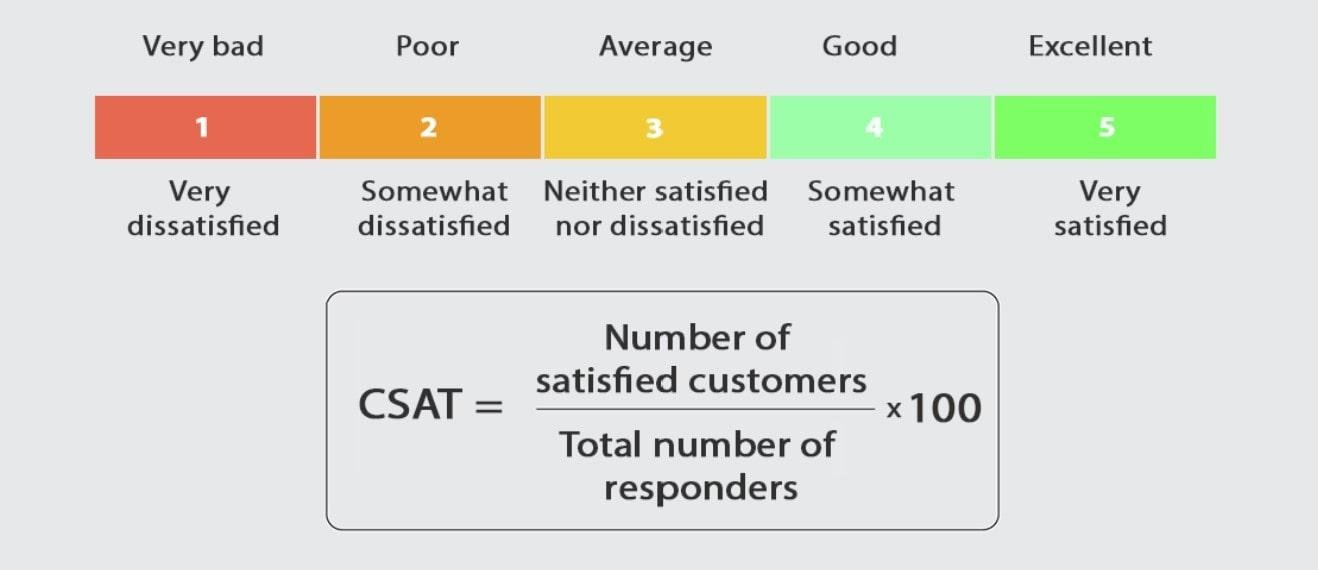
Customer Satisfaction (CSAT) score is a customer experience metric that gauges how satisfied your customers are with a specific interaction, product, or service.
It’s typically measured by asking customers to rate their satisfaction on a scale, often from 1 to 5, after an interaction or purchase.

The CSAT score is calculated by taking the number of satisfied customers (those who rated you 4 or 5), dividing it by the total number of respondents, and multiplying by 100 to get a percentage.
For example, if 80 out of 100 customers rated their experience as 4 or 5, your CSAT score would be 80%.
A high CSAT score indicates that your customers are happy with their experience, while a low score highlights areas needing improvement.
Regularly measuring and analyzing your CSAT score helps you maintain high standards of service, improve customer satisfaction, and reduce churn.
Ticket backlog
Ticket backlog pertains to the accumulation of unresolved customer service requests that have yet to be addressed or closed.
It’s measured by counting the number of open tickets at any given time, particularly those that have been waiting for resolution longer than your typical response time.
For example, if you have 200 open tickets and your team can typically handle 150 tickets per day, you have a backlog of 50 tickets.
Ticket backlog plays a significant role in customer experience, as a growing backlog can lead to delays in addressing customer issues, causing frustration and dissatisfaction.
When customers have to wait longer for resolutions, it damages their perception of your service quality.
By regularly monitoring and reducing backlog, you ensure that your team can provide timely support, leading to a better overall experience for your customers.
Average reply time
Average response time measures how quickly you address customer inquiries or support requests. It’s calculated by taking the total time spent responding to all tickets and dividing it by the number of tickets.
For instance, if your team responds to 100 tickets in a total of 500 hours, your average response time is 5 hours per ticket.
This customer experience metric directly impacts how customers perceive your service. A short average response time means you handle issues promptly, which enhances customer satisfaction and builds trust.
For example, if customers expect quick resolutions and you consistently meet that expectation, they feel valued and are more likely to stay loyal.
Conversely, a long response time can frustrate customers, leading to negative reviews and potential churn.
By monitoring and improving your average response time, you ensure a more efficient support process and a better experience for your customers.
Replies per resolution
Replies per resolution measures how many interactions or messages are needed to resolve a customer’s issue. You calculate it by dividing the total number of replies by the number of resolved tickets.
For example, if your team resolves 100 tickets with a total of 400 replies, your replies per resolution rate is 4.
A lower replies per resolution rate indicates that your team can address issues effectively with fewer interactions, which enhances the customer’s experience by providing faster and more streamlined support.
For instance, if customers frequently have to send multiple messages to resolve their issues, they might feel frustrated and undervalued.
By tracking and optimizing this metric, you can improve the efficiency of your support team, reduce customer effort, and boost overall satisfaction.
Over to you: customer experience metrics
As you can see, understanding and leveraging customer experience metrics is crucial for improving how you interact with your customers.
By focusing on metrics like ticket volume, average resolution time, and Net Promoter Score (NPS), you gain valuable insights into customer satisfaction and operational efficiency.
Each metric provides a unique perspective on different aspects of your customer service, from response speed to overall satisfaction and loyalty.
Staying proactive with these measurements enables you to refine your strategies, boost customer satisfaction, and foster long-term loyalty.
Did I miss anything? Did you try measuring customer experience? Do you have any questions or comments? Share your thoughts below in the comments section.


